Terms You Will Hear In The Educational Materials & In The Live Education Classes & Common Questions.
STOP – RISK: This is the price or amount of money you will be risking on the trade. TICKS – PIPS POINTS: This refers to the smallest price increment for an instrument. Usually used in the phrase, “I made 20 ticks on that trade or lost 8 ticks on that trade”. TARGET PROFIT EXIT: This is the price at which you will exit your position with a win. BE - BREAK EVEN – NO RISK – BE+1: This is a term used in the chat room that represents the fact that you have now moved your protective stop in a trade to a no-risk situation.
GRACEFUL EXIT: When the conditions have changed against your trade position. Take an exit that is not a full loss. You must exit the trade when conditions change.
“SYNTHETIC” FIBS - TRIGGERS -DIVERGENCES - MID BANDS: Any indicator that came from a different chart that is plotted on the chart you are looking at.
FIBONACCI SUPPORT: Refers to a blue line that runs horizontally on the chart.
FIBONACCI RESISTANCE: Refers to a red line that runs horizontally on the chart.
HVA SUPPORT/ RESISTANCE (LINE): The market flow GREEN or MAGENTA lines. These are generated from white paint bars on the range-based T3 Market Flow chart. Usually very helpful in defining support or resistance with trigger lines crossed in the same direction as the trend.
MID BAND: Green or magenta moving average line running in the middle. 55-period Moving average
SUPPORT: ( general ) Any area that might cause the market to bounce up. This may include but is not limited to mid-bands, trigger lines, or Fibonacci areas that may cause a bounce for entry or profit target.
RESISTANCE : ( general ) Any area that might cause the market to bounce down. This may include but is not limited to mid-bands, trigger lines, or Fibonacci areas that may cause a bounce for entry or profit target.
TRIGGERS, SMALL TRIGGERS, LARGE TRIGGERS, SYNTHETIC TRIGGERS, 13-2 Triggers, 8-Range small triggers: These are descriptive of T3 Trigger Lines. Either from a particular chart or a particular line.
SMALL TRIGGERS: These are the fastest and closest to the bar trigger lines. They use a 20-period or bar average.
LARGE TRIGGERS: These are the medium-fast triggers. They use a 38-period or bar average.
SYNTHETIC TRIGGERS: Generally much larger than small triggers or large triggers. This set of trigger lines comes from a much larger chart. These triggers visually “STAIRSTEP” up and down the charts.
STRONG LOOK- #1 LOOK (trigger lines): This is when all trigger lines are strongly crossed up or down. The small trigger will ALWAYS BE ABOVE all of the other when strong #1 look is up, and the small triggers will ALWAYS BE BELOW all of the other triggers when #1 is down. See Trading Plan
TRANSITION LOOK (trigger lines): This is when the small triggers CROSS ABOVE OR BELOW all other triggers for the first time. This will start a trend trade and have specific management implications.
WEAKING or INSIDE LOOK (trigger lines): The market is usually trending, and this is when the small triggers start to get “inside” the larger triggers. This represents the need to read the Fibonacci support and resistance areas to know if you should keep trading with the trend or stop. See Trading Plan
RANGE BOUND – CHOPPY – CHOP: (trigger lines and market) – This is when the small triggers are BETWEEN the large and synthetic triggers. This also refers to when the market has no trend.
YELLOW DOTS - ONE TO ONES: a Fibonacci projection of 100%. One swing distance is equal to the next swing. These are represented mostly by YELLOW DOTS or Magenta dots and may represent general support or resistance. https://www.screencast.com/t/s3s5dBVPrZ
SMALL SWING ONE TO ONES: "Magenta dots" 100% projections from each smaller swing plotted by the T3 Fibs ProTrader.https://www.screencast.com/t/RIRTUqjSL
DIVERGENCE LINE(S): This is what the (-#’s) are called that plot on top or bottom of bars. These represent a divergence between T3 Macd BB lines and Price. Please refer to the trading plan for use. https://www.screencast.com/t/s3s5dBVPrZ
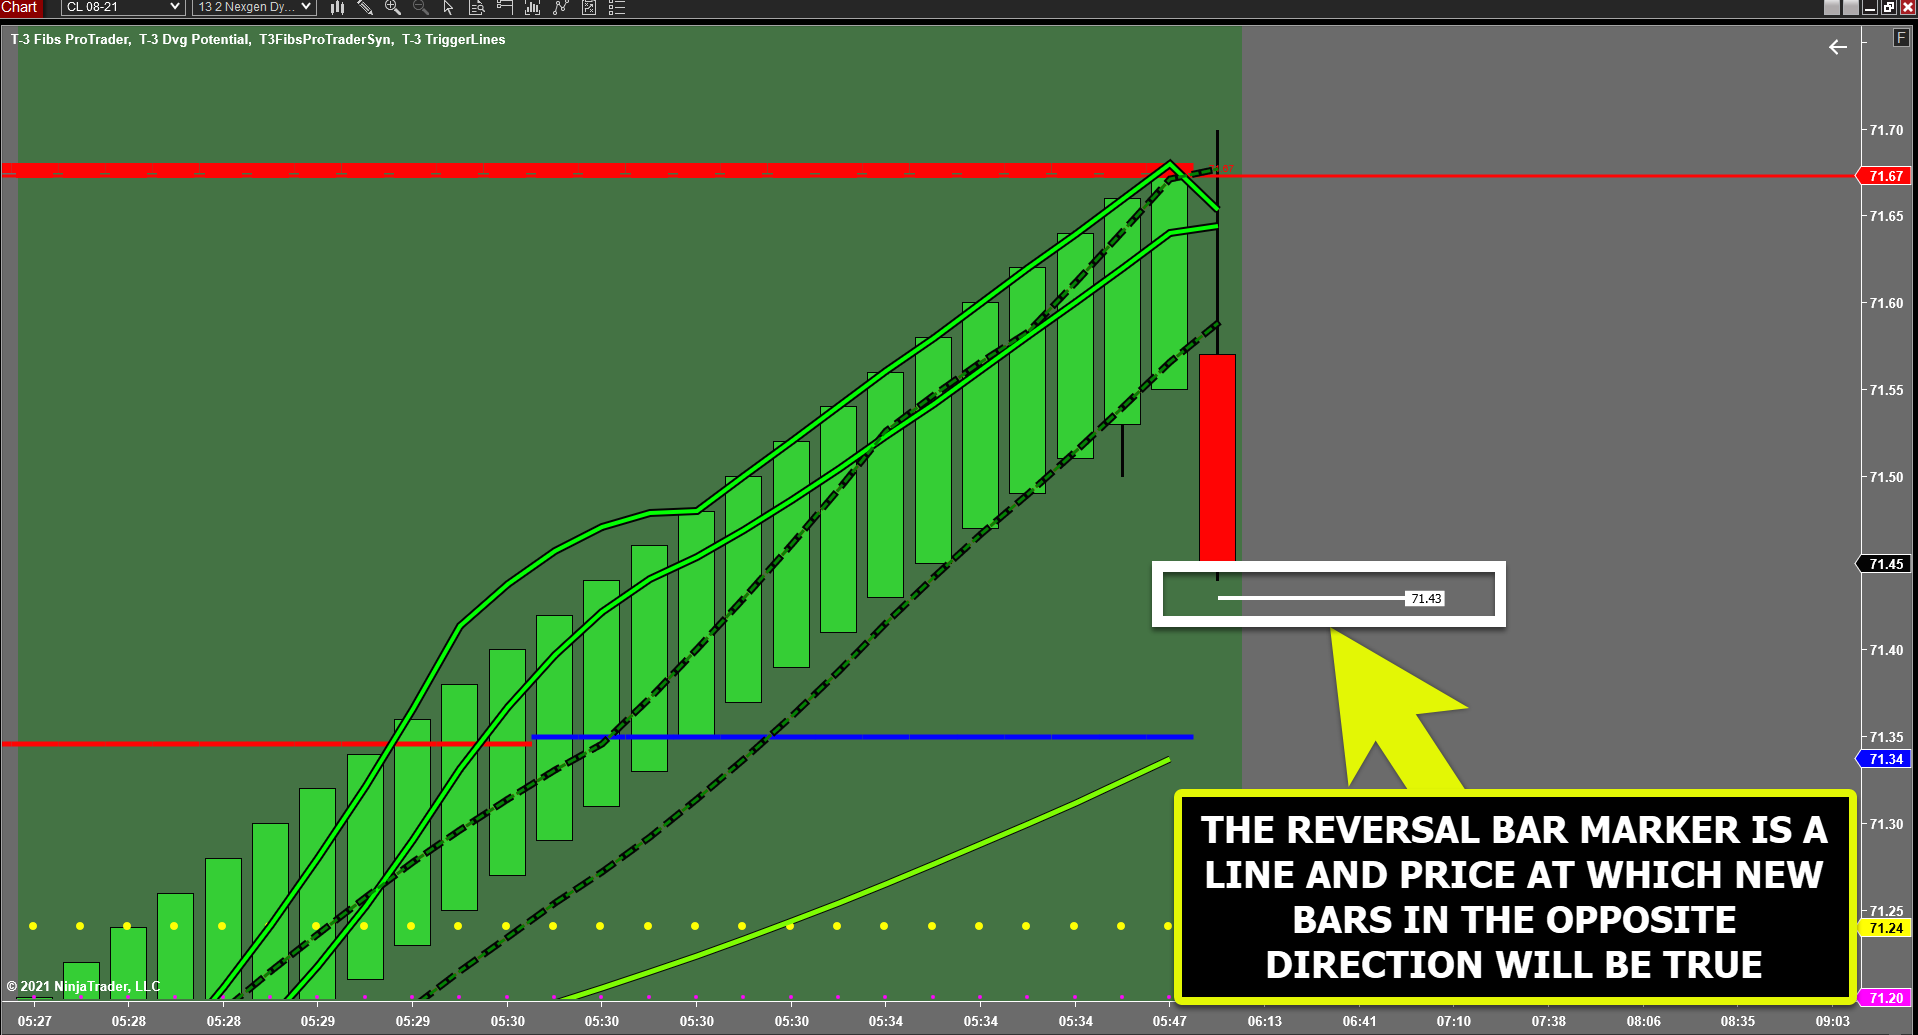
REVERSAL BAR MARKER: the price at which a new bar in the opposite direction will occur. https://nexgent3.com/wp-content/uploads/2021/07/reversal-marker.png
BINGO: You will hear this term many times when a profit target has been reached and filled on a winning trade.
RUNNER: Phrase used to describe a "fraction" usually 25-50% of the number of contracts that will remain in the trade in an attempt to make a very large profit. Typically used in a parabolic market or when Fibonacci targets are "far away" and the trigger lines are strong. https://www.screencast.com/t/2brdf1TMj
LONG - BUY – GO LONG -ENTER LONG: To take a position in the market when you anticipate that prices will be going up over the near term.
SHORT - SELL: To take a position in the market when you anticipate that prices will be going down in the near term.
HIGH PROBABILITY TRADE: Defined as when each indicator on every chart agrees with rules for the trade. Typically, this is when all triggers are their strongest, no termination conditions exist, and there are no trouble spots between your entry and your target.
MEDIUM PROBABILITY TRADE: Defined as when most indicators line up for a trade, however, a small issue exists. This will be the vast majority of your trades. When executing medium-probability trades, you will take these trades and manage them assertively. If there is trouble in your way, you may take a portion of the position off at that trouble spot, and reduce risk to a zero loss level.
LOW PROBABILITY TRADE: Defined as when chances of winning the trade are low. The trade setup on small charts has a large number of reasons on the larger charts “hurt” your chance of winning. This is when the trigger lines area is weak or configured poorly, Fibonacci areas, prior divergences, and one or more charts have termination conditions that will stop you from trading into areas.
TERMINATION AREA / CONDITION: This is any condition that happens on the charts that will have a high probability that the trend will end. This is a good condition for “counter-trend” trading and is also the key condition to know when to “stop” taking trend trades in the direction of the trend.
LIMIT ORDER – ENTRY: This is when the user places an order at a specific price before the market reaches that price in an attempt to enter an exact spot. This is done by right-clicking on the chart and buying or selling using an entry-limit order.
GAP – BIG GAP – GAP TO SYNTHETICS: This describes the market being at support or resistance and the SYNTHETIC triggers being very far away from that current price. Generally used in edge or counter-trend trading.
RETRACEMENT – PULLBACK: This describes a small move in price counter to the underlying trend.