> For the complete documentation index, see [llms.txt](https://nexgen-software-services.gitbook.io/nexgens-software-day-trading-documentation/llms.txt). Markdown versions of documentation pages are available by appending `.md` to page URLs; this page is available as [Markdown](https://nexgen-software-services.gitbook.io/nexgens-software-day-trading-documentation/indicator-packages/ninjatrader-8-indicators/5.-high-probability-trades.md).
# 5. High Probability Trades
Understand High Probability Trading Rules.
{% hint style="success" %}
**Live, 5 days a week**, Nexgen will teach you three rules on only two charts to give you the skills to recognize advantages and turn them into trades. Each rule is discussed individually, helping you master how to enter the **highest probability trend trade** taught.
{% endhint %}
***
1. The advantage of momentum is defined through strong trigger lines.
2. The advantage of a clear path is defined by NO termination conditions.
3. The advantage of entering where the trend is most likely to continue is using a combination of Fibonacci and triggers for low-risk precision.
Momentum & Clear Path Are The Core
These two concepts alone are enough to create a trading plan that is consistent and profitable. Study them, learn them, commit to them, and once the recognition is second nature, you will find YOUR best entry.\
\
Until you do, the High probability trend trade gives you a trade that embraces the advantages and has the potential to win 70-80% of the time. It is a trade that helps you recognize the advantages of momentum and a clear path through rules one and two, and it is a trade that will build confidence in those advantages. The HPTT is NOT your only trade, *it’s your first trade*. Learn it, and the possibilities will seem endless.
Nexgen High Probability Trend Trade-Three rules on Two charts.
***
The Advantage Of Momentum ( Large Chart )
Rule one, strong triggers, let you know the market is moving with momentum. A simple comparison between small and large triggers will let you know if you have that advantage or if you need to be patient. Strong triggers are universal, no matter what chart you are using. Let yourself be very black or white on whether you have strength or weakness. Only one provides the advantage needed to go on to rule two.
***
The Advantage Of A Clear Path ( Large Chart )
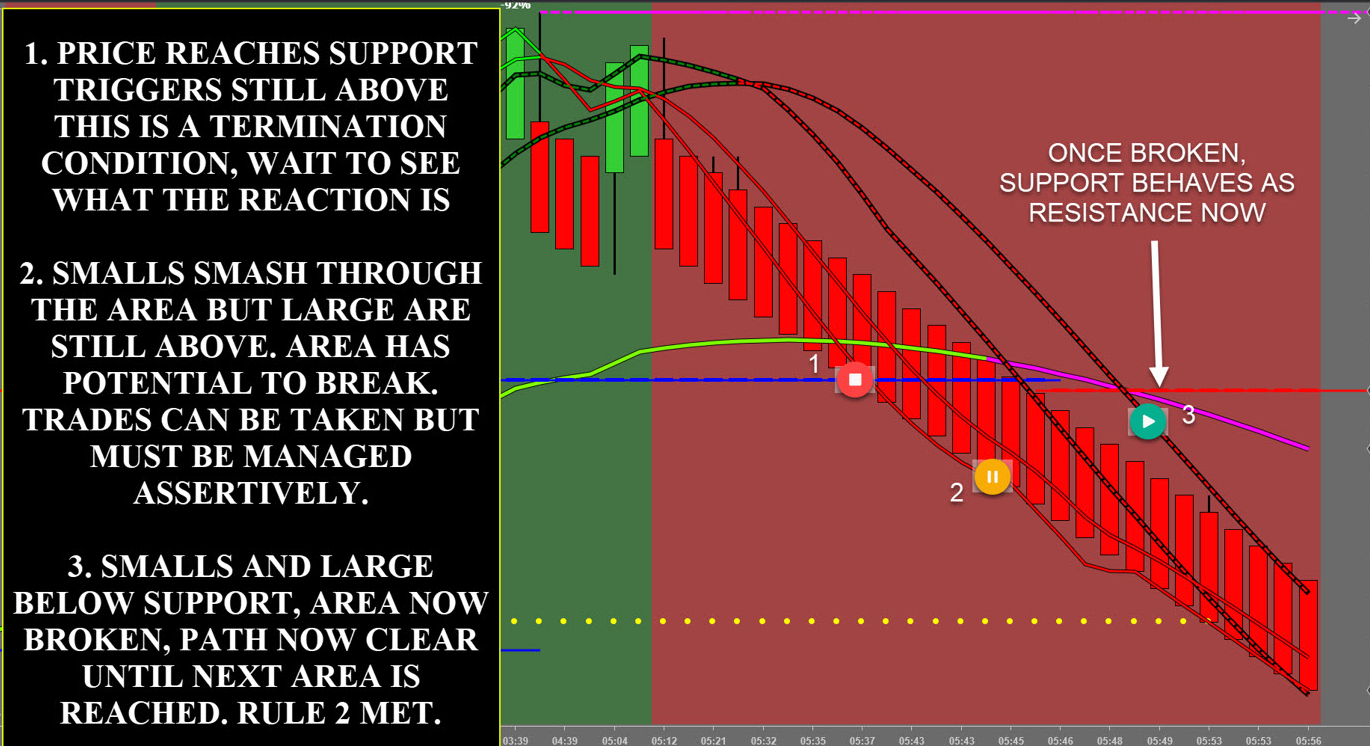
Rule #2, the advantage of a clear path, comes from NOT having any termination conditions present. A clear path assures you have room to reach profit targets. A termination condition is a Fibonacci-based indicator that has the potential to stop or reverse the market.
***
Defining A Termination Condition Is A Simple, Two-Part Process
1\. Allow Dynamic Renko bars to reach any of the areas.
2\. Ask, “Where are my triggers?” Triggers will let you know the status of the area and if you need to wait a minute to gauge the reaction in the area.
Any area that is defined as a termination condition has an unpredictable future. It could create a fight between buyers and sellers that you won’t want to be a part of. This is when consolidation and chop affect your trades.
It could break, and the market may continue beyond the area.
It may reverse completely, changing market direction. Any termination condition that reverses the market is deemed
### 3 Things Take Place When The Price Reaches An Area Until The Area Is Broken
1. Resistance Breaking
2. Support Breaking
3. Patience
{% hint style="warning" %}
Termination conditions will force patience. There will be times when you must simply wait. It takes $400/day in a typical trading year to surpass $100,000 in profits for the year. It’s not necessary to be in every move.
{% endhint %}
***
The Advantage Of Pin-Pointing Your Entry Area
The high probability trend trade uses a smaller, faster chart to refine the advantages that the large chart gives you. Inside **ONE** bar on the large chart are typically 20-30 smaller, faster bars on a small chart. This refinement allows risk reduction and large profits. Your rules will have you buying or selling a pullback (this is a small retracement counter to the underlying trend) at an area (Fibonacci support or resistance, midbands, or yellow one-to-ones) INSIDE of trigger lines.
When Rules 1 & 2 Are Met, It's Time To Define Your Entry
1. Wait For A Reversal Bar On Your Small Chart
2. Identify Trigger Lines To Determine The Most Likely Retracement Level
3. Define Area(s) Inside Of Trigger Lines
4. Set Your Entry Order
5. You Are In The Trade
{% hint style="info" %}
Repetition is key to understanding. Practice your entries on the simulator, but even more importantly, do a historical study to be sure you trust and understand what you’re looking for.
{% endhint %}
***
***